
The Death of the Static Dashboard: How Conversational AI is Replacing the 14-Tab Business Review
Founders waste 11+ hours every week staring at 40 conflicting charts in Looker, Tableau, and Shopify. Here is how conversational AI replaces passive dashboards with causal root-cause diagnostics, margin leakage detection, and closed-loop execution.
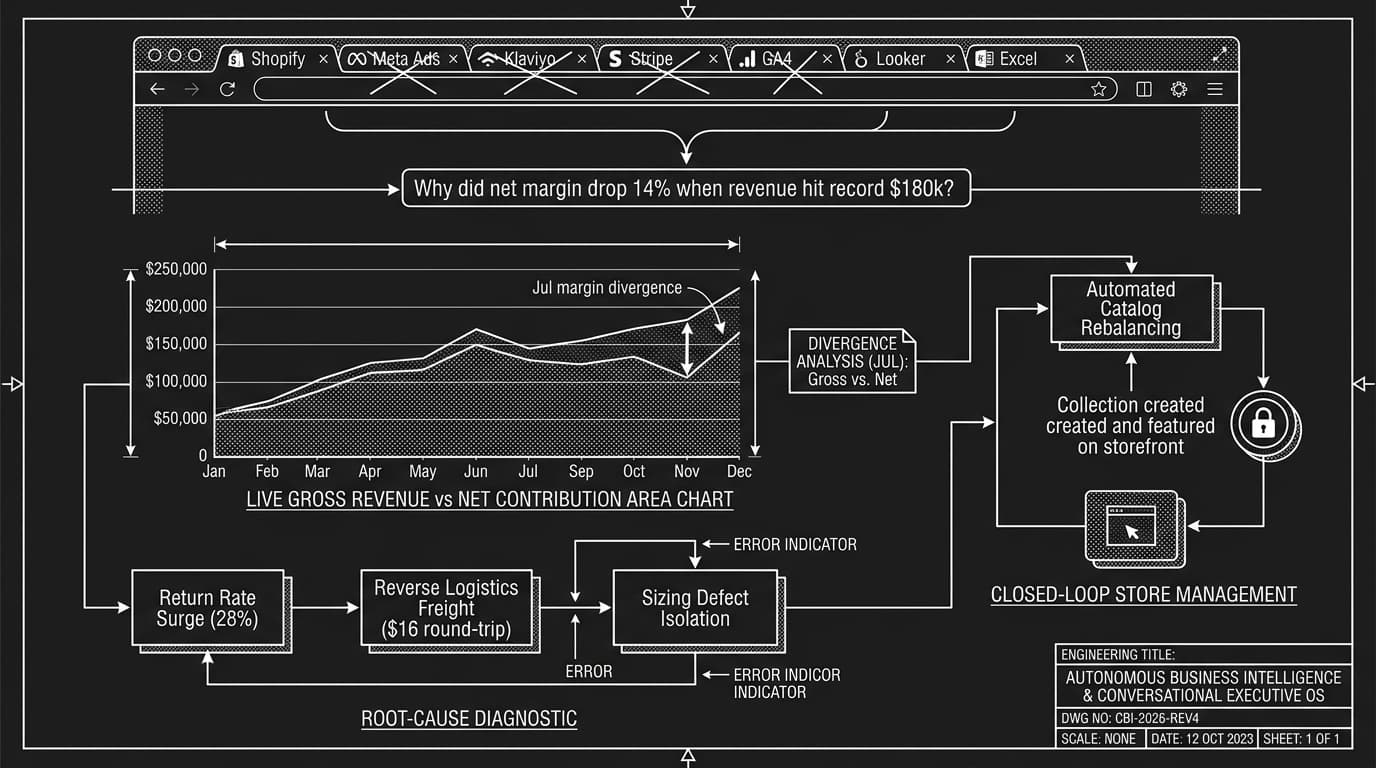
1. The Dashboard Dilemma: Why 40 Graphs Don’t Equal Answers
Most founders start their Monday morning by opening a dozen browser tabs:
- ›Shopify Analytics to check top-line GMV.
- ›Meta & Google Ads Manager to check ROAS and blended customer acquisition cost (CAC).
- ›Klaviyo to check email open rates and automated flow attribution.
- ›Stripe to check net payouts, disputes, and refund volumes.
- ›Google Sheets / Excel to calculate what is actually left over after COGS, freight, packaging, and payment processing fees.
Here is the dirty secret of modern analytics: Dashboards are descriptive, not diagnostic.
A dashboard can show you that your gross revenue is up 18% while your cash balance is down $12,000. But it won’t tell you why. It won’t tell you that your customer acquisition cost quietly crept up 35% on TikTok, or that customer returns on your new collection jumped from 4% to 19% due to a sizing defect, wiping out your margins.
Founders don’t need prettier graphs. Founders need clarity, causal analysis, and direct execution.
2. What Is Autonomous Conversational Management?
Conversational management bridges the gap between data storage and operational execution.
Instead of requiring an in-house data analyst or spending Sunday night writing VLOOKUP formulas, you treat your AI workspace as an on-demand Chief Operating Officer and Finance Director:
How executive decision-making transforms when moving from static charts to conversational reasoning
| Dimension | Traditional BI (Tableau, Looker, GA4) | Conversational Management (Orbit) |
|---|---|---|
| Input Interface | Rigid SQL queries, drop-down filters, pre-built static widgets | Natural conversational questions in plain English |
| Data Synthesis | Siloed by tool (Shopify only sees sales; Meta only sees ad clicks) | Cross-ledger synthesis (combines orders, ad spend, inventory run-rate & margins) |
| Analytical Depth | Descriptive: Tells you what happened in the past | Diagnostic & Prescriptive: Explains why it happened and gives an action plan |
| Execution Loop | Zero execution capability (you have to switch apps to fix the issue) | Closed-loop execution (you can tell Orbit: "Apply those price changes now") |
| Memory & Context | Stateless (no recollection of your Q4 goals or brand margin floors) | Persistent business memory (retains your target margin thresholds and growth targets) |
3. Four Real Executive Questions You Can Ask Your Business
Let’s examine how this works in real business scenarios.
Case 1: "Why is our net profit down when sales hit an all-time high?"
The Scenario: You just closed your biggest revenue month ever ($180,000). Yet your bank account has less cash than it did when you were doing $110,000.
The Traditional Investigation: You spend 3 days exporting order logs, matching SKU costs, cross-referencing refund rates, and comparing ad spend invoices.
The Conversational Orbit Approach: You type into your workspace: "We hit record gross sales of $180k last month, but net profit shrank by 14%. Run a full unit-economics audit and show me where our margin leaked."
How hidden logistics costs and high-return SKUs eroded monthly profitability
The AI’s Diagnostic Output & Answer:
- ›Identified the Culprit: A newly launched apparel line accounted for 42% of new sales, but had an unprecedented 28% return rate due to waist sizing running one size too small.
- ›Reverse Logistics Toll: Two-way shipping fees ($16 round-trip per return) and unsellable packaging completely wiped out the initial margin.
- ›Prescriptive Action Plan: Update the size guide on the live product detail page immediately to advise sizing down; restrict ad spend on the two highest-returned colorways until sizing copy is updated; and adjust the reorder batch with your manufacturer to correct pattern tolerances.
Case 2: "Which 20% of our products are driving 80% of our actual profit?"
The Scenario: You carry 120 SKUs in your catalog. You have limited working capital for your next production run and cannot afford to lock cash up in slow-moving inventory.
The Conversational Orbit Approach: "Run a Pareto margin analysis across our entire catalog for the last 90 days. Factor in product COGS, pick/pack fees, return rates, and dedicated ad spend. Group SKUs into Tier 1 (Cash Drivers), Tier 2 (Stable), and Tier 3 (Dead Weight)."
Segmenting 120 catalog SKUs by True Contribution Margin after marketing and returns
| Product Tier | SKU Count | Revenue Share | True Net Profit Share | Recommended Executive Action |
|---|---|---|---|---|
| Tier 1: Core Cash Drivers | 14 SKUs (11%) | 68% ($240,000) | 84% ($88,200) | Protect stock at all costs; increase automated reorder thresholds |
| Tier 2: Steady Performers | 38 SKUs (32%) | 22% ($77,500) | 21% ($22,050) | Maintain lean reorder cadence; sell primarily through organic & email |
| Tier 3: Margin Bleeders | 68 SKUs (57%) | 10% ($35,200) | -5% (-$5,250) | Liquidate via bundle flash sale; do not restock |
Instead of guessing where to invest, you know that 68 of your products are actively costing you money once storage, returns, and paid ads are factored in.
Case 3: "If we run a 20% flash sale this weekend, how many extra units must we sell to break even?"
The Scenario: It’s Tuesday before a major holiday weekend. Your marketing manager wants to send an email blast offering 20% off site-wide.
The Conversational Orbit Approach: "Evaluate a 20% store-wide discount for this weekend. Based on our 58% blended gross margin and current average order value of $84, calculate the volume elasticity needed so our gross profit dollars don’t decrease."
- ›Current Baseline: At a 58% gross margin, selling 500 orders at $84 generates $24,360 in gross profit.
- ›The Discount Math: If you cut retail prices by 20%, your gross margin drops from 58% to 47.5%.
- ›The Volume Requirement: To generate that same $24,360 in gross profit at the discounted margin, your store must process 610 orders—a +22% increase in sales volume.
- ›Prescriptive Recommendation: Rather than a blanket 20% markdown, use a tiered threshold: "Spend $100, Get $20 Off". This lifts your Average Order Value (AOV) from $84 to $108, protecting your margins while offering customers an attractive incentive.
Case 4: "We have $30,000 in cash for holiday inventory. What is the optimal allocation?"
The Scenario: You need to wire a deposit to your overseas supplier today. If you over-order the wrong items, your cash will be trapped in warehouse boxes until spring. If you under-order your heroes, you’ll be sold out by Black Friday.
The Conversational Orbit Approach: "Allocate $30,000 in inventory replenishment across our catalog for Q4. Prioritize SKUs with high stock turnover, low return rates, and lead times greater than 4 weeks."
The AI cross-checks supplier unit costs, minimum order quantities (MOQs), historical Q4 seasonality curves, and delivery lead times—generating a ready-to-send purchase order breakdown in seconds.
4. Closed-Loop Management: The Shift from "Looking" to "Doing"
The biggest limitation of conventional software tools is that they are disconnected silos:
- ›When an analytics tool shows that a SKU is losing money, you still have to log into Shopify to change the price.
- ›When an inventory report shows you’re running low, you still have to manually type an email to your warehouse.
- ›When your marketing dashboard shows an ad angle is burning budget, you still have to navigate into Meta Ads Manager to toggle it off.
In a unified AI workspace like Orbit, the intelligence layer is directly connected to the store operations layer:
- ›1. You Ask: "Which 5 products have the highest conversion rate but the lowest homepage visibility?"
- ›2. Orbit Answers: "These 5 silk loungewear sets have a 4.8% conversion rate from search, but are buried on page 3 of your catalog."
- ›3. You Direct: "Create a new collection called 'Customer Favorites', add these 5 products, and feature them on the storefront hero grid."
- ›4. Orbit Executes: The collection is created, the products are attached, the storefront layout is updated, and the changes go live instantly.
You didn’t just analyze your business—you managed it.
5. The Future of the Founder’s Workflow
The modern founder shouldn’t spend their week acting as a human connector between SaaS subscriptions.
Business management in 2026 is shifting away from static dashboards and complex spreadsheet formulas toward high-context conversational systems.
When you can question your data in natural language, uncover hidden margin leaks in seconds, and execute operational updates in the same breath, you stop working for your software—and your software starts working for you.
[ CROSS-REFERENCES · EXPLORE RELATED ARCHITECTURAL DEEP-DIVES AND AUTONOMOUS E-COMMERCE SYSTEMS IN ORBIT: ]
Frequently Asked Questions
- [Q]How does conversational BI connect to our private store data?
- Orbit connects directly via read-optimized read/write webhooks and API keys (Shopify Admin GraphQL, Stripe, Supabase PostgreSQL, Meta Marketing API). Data is queried live in-memory and never trained on public base models.
- [Q]Can conversational BI accidentally make unwanted price or catalog changes?
- No. Orbit enforces deterministic Confirmation Gates. Read queries and diagnostic margin analyses run automatically, but any state-mutating actions (updating catalog prices, issuing discounts, reallocating ad budget) require explicit human authorization before executing.
- [Q]Does this replace our existing store tools or work with them?
- Orbit integrates with your existing tech stack. It sits on top of your Shopify, Stripe, Meta Ads, and warehouse ledgers as a unified intelligence and execution layer, eliminating the need to toggle between 14 separate tabs.
Build with Orbit AI Developer Workspace
Connect live databases, generate native Expo mobile codebases, and eliminate fragmented subscriptions inside one continuous environment.